
Mormon Fertility: 6 indicators
I discovered that the CDC keeps a record of every birth certificate in America going back to 1968 (at least the metadata). You can actually download all the metadata yourself, but the version they let you download redacts all the geographic (county) data. Which makes it kind of useless. BUT you can query the data for certain statistics through wonder.cdc.gov.
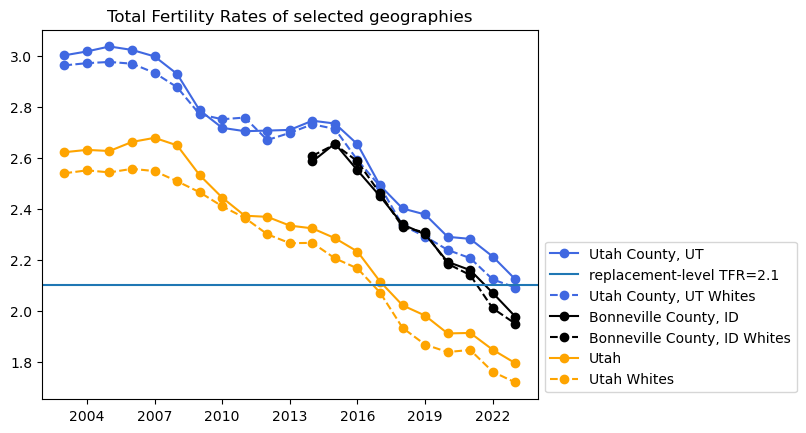
There are a few things I've been "wondering" about Mormons and their famously-high fertility since I saw this report which said the white fertility in Utah fell below replacement-level in 2017. So I queried the data for 3 representative geographies: the first obvious one being Utah (the Mormon Mothership) but Utah is pretty multicultural these days so you can't get an accurate picture of what's happening with the Mormons just by looking at Utah. Two much better geographies are Utah County, Utah (home of Brigham Young University) and Bonneville County, Idaho (neighbor of Brigham Young University - Idaho). These two yuge 99% Mormon universities make both of these counties nearly Mormon-monocultural so they should be great indicators of the current fertility rate in the Mormon community. Here are the results:
Edit 10:30PM MST: Thank you @PoisonAero for correcting the calculations! Now they are actually the Total Fertility Rate, and not the Crude Fertility Rate.Edit 29 Oct 2021: Updated charts adding 2020 Natality data
Edit 3 Dec 2022: Updated charts adding 2021 Natality data
Edit 23 Sept 2023: Updated charts adding 2022 Natality data
Edit 20 Oct 2024: Updated charts adding 2023 Natality data
Sources:
Every value in the "Fertility Rate per 1,000" column of the following tables is an average annual fertility of women over a 5-year age range. To convert to Total Fertility Rate (TFR), sum the cohort-fertility rates together, multiply by 5, and divide by 1000.Everyone:
2003-2006 https://wonder.cdc.gov/controller/saved/D27/D315F6852007-2015 https://wonder.cdc.gov/controller/saved/D66/D315F693
2016-2021 https://wonder.cdc.gov/controller/saved/D149/D315F694
Non-Hispanic Whites:
2003-2006 https://wonder.cdc.gov/controller/saved/D27/D315F6952007-2015 https://wonder.cdc.gov/controller/saved/D66/D315F690
2016-2021 https://wonder.cdc.gov/controller/saved/D66/D411F146
Addendum
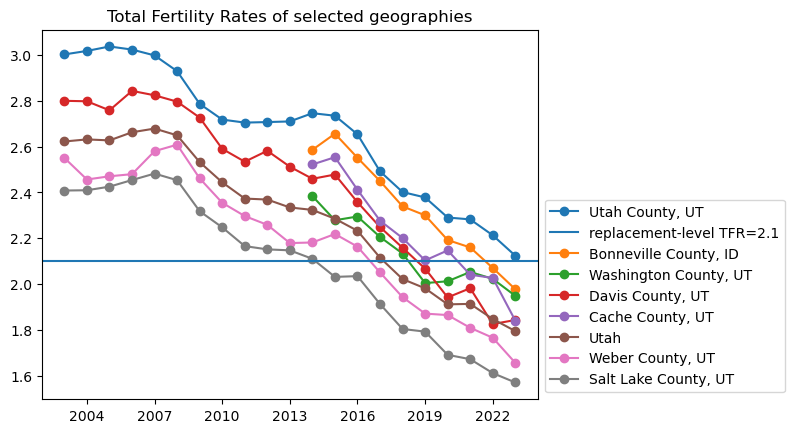
Due to expressed interest, I have created a chart that shows the fertility rate of every county in Utah with available data (there were only 6 available counties). I have updated the source links as well; they now link to tables that include all available counties in Utah and Idaho.
If you compare to the SLTRIB chart that shows percent LDS for each county in Utah, you will see there is an almost 1-to-1 ordering between "percent LDS" and TFR.
Cohort fertility in Utah County
Utah County serves as a useful case study to see what is happening to fertility by age group. There have been large declines in cohort-fertility rate for 20-29 year olds while the cohort-fertility rate of 30-39 year olds has remained stable.
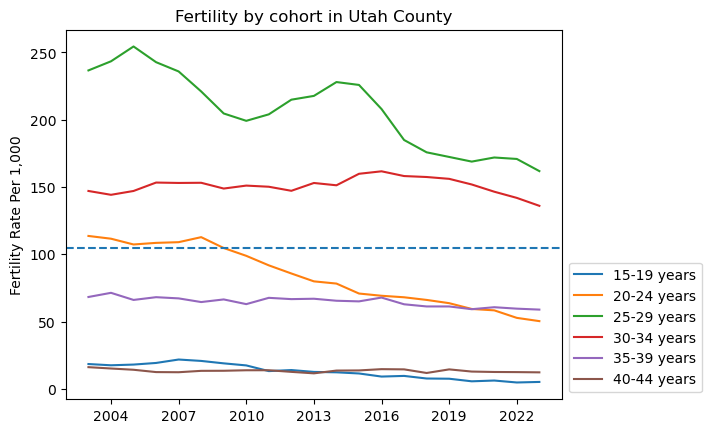
I added a horizontal dashed line to the graph at the 105 births per 1000 population mark. There are 6 female cohorts plotted in the graph but only 4 of the cohorts contribute to the total fertility rate in a non-negligible way (20-24 years, 25-29 years, 30-34 years, and 35-39 years). The dashed line represents the average fertility these 4 cohorts must reach by themselves to push the total fertility rate above replacement.