
Contra Jared Taylor: Blacks are not 35 Times as Likely to Attack Whites as the Reverse
This post has a companion. Click here to read about why the reverse claim is also incoherent.
This post is a response to Jared Taylor's article and video in which he claims that blacks are 35 times more likely to attack whites than the other way around in the United States. I will use hypothetical scenarios and county-level crime data to motivate and substantiate an alternative claim: that if the black population were equal to the white population in the United States, then blacks would be 7.63 times as likely to attack whites as the reverse.
Hypothetical Scenario 1: All violence is random
Consider a hypothetical town with 100 green-eyed people and 900 blue-eyed people. In this town, 1 out of every 10 people attacks a random person.
Simple calculations determine the expected outcome: 90 blue-eyed people commit attacks; their victims are 81 blue-eyed people and 9 green-eyed people. 10 green-eyed people commit attacks; their victims are 9 blue-eyed people and 1 green-eyed person.
At first it seems that blue-on-green violence is in parity with green-on-blue violence. Nothing is amiss in this town in terms of inter-ocular violence. But consider this perspective: A green-eyed person is 9 times as likely to attack a blue-eyed person as a blue-eyed person is to attack a green-eyed person. This claim is indisputably true, but intuitively it feels like nonsense. What went wrong? It is not an incorrect claim, it is an incoherent claim.
Incoherence creeps into the claim at the ambiguity of the phrase "a person". The phrase "a person" either means "any of the persons of a group" or it means "one particular person of a group".
The claim above is only true when it is interpreted as follows:
- One particular green-eyed person is 9 times as likely to attack any of the blue-eyed persons as one particular blue-eyed person is to attack any of the green-eyed persons.
Alternative true claims are as follows:
- One particular green-eyed person is 9 times as likely to be attacked by any of the blue-eyed persons as one particular blue-eyed person is to be attacked by any of the green-eyed persons.
- One particular green-eyed person is equally likely to attack one particular blue-eyed person as one particular blue-eyed person is to attack one particular green-eyed person.
- Any of the green-eyed persons attacking any of the blue-eyed persons is equally as likely to occur as any of the blue-eyed persons attacking any of the green-eyed persons.
All four claims are correct, but claims 1 and 2 are meaningless because they are incoherent. It is clear they are incoherent because statement 1 makes the green-eyed people seem like victimizers while statement 2 makes the green-eyed people seem like victims. The claims seem to be making observations about rates of inter-ocular violence, but actually they are only making observations about the minority status of green-eyed people.
Hypothetical Scenario 2: all inter-ocular violence is directed
Consider a different hypothetical town with 900 blue-eyed people and 100 green-eyed people. In this town, all the blue-eyed people live on one side of a river, and all the green-eyed people live on the other side of the river. The residents only cross the river when they feel like committing an inter-ocular crime. On both sides, 1 out of every 10 people feels like committing an inter-ocular crime.
In Scenario 1, it did not make sense to talk about violence committed by one particular person against any of the persons of a group, because each attack was inflicted on one particular person randomly. In Scenario 2, it does make sense to talk about violence committed by one particular person against any of the persons of a group, because I have stipulated that each inter-ocular attack is inflicted on any of the persons of the other group.
In Scenario 2, as I have so far described, one particular green-eyed person is equally as likely to attack any of the blue-eyed persons as one particular blue-eyed person is to attack any of the green-eyed persons. However, if I modify it so that G out of 10 green-eyed people feel like committing an inter-ocular attack and B out of 10 blue-eyed people feel like committing an inter-ocular attack, then the correct claim becomes as follows:
- One particular green-eyed person is G/B times as likely to attack any of the blue-eyed persons as one particular blue-eyed person is to attack any of the green-eyed persons.
And in this scenario, the ratio of G/B becomes a meaningful metric to measure and ponder. If all inter-ocular crime is directed, and if the blue-eyed population is equal to the green-eyed population, then G/B is also the ratio of actual green-on-blue crimes committed to actual blue-on-green crimes committed.
Scenario 3: Reality
It is probably obvious that I'm using "blue-eyed" and "green-eyed" as an emotionally neutral mask to the real question at hand, namely race and violence, specifically between blacks and whites. In reality, there is a certain amount of interracial violence that is random and color-blind. There is also a certain amount of interracial violence that is directed, where a black guy is determined to attack the first white person he sees, or a white guy is determined to attack the first black person he sees. My contention is that the majority of interracial crime is random, that reality is closer to Hypothetical Scenario 1, but reality has some elements of Hypothetical Scenario 2.
Jared Taylor makes the claim that in the United States, blacks are 35 times more likely to attack whites than the other way around. The formulation of his claim is the same as the form of claim 1 in Hypothetical Scenario 1. Whether or not this claim is meaningful depends on the situation. If all or most interracial crime is directed, then the claim is coherent and meaningful. If all or most interracial crime is random, then the claim is incoherent and meaningless.
We can try to get to the bottom of things by exploring the following question: what would the rates of interracial violence be if the black population were equal to the white population? We can't answer this question with the NCVS [1], because the NCVS data is only reported at the national-level, where the current ratio of white population to black population is fixed at about 5. But we can attempt to answer the question with the 2020 NIBRS [2] data, because the NIBRS reports each incident at the county level, and the counties of the United States have many different values for the ratio of white population to black population. One limitation of the NIBRS is that it does not distinguish between so-called "hispanic white" offenders and "non-hispanic white" offenders, so I'm only going to use the NIBRS to explore interracial violence between "blacks" and "whites (hispanic+non-hispanic)".
To make a long story short, I'm going to make each county a data point, and plot "logarithm of the ratio of black-on-white violent incidents to white-on-black violent incidents in 2020" as the dependent variable, and "logarithm of the ratio of white population to black population in 2020" as the independent variable. It's important to take logarithms to transform a hyperbolic operation (taking a ratio) into a linear operation. That makes choosing a black-to-white ratio equivalent (up to a sign) to choosing a white-to-black ratio, so that the choice becomes arbitrary. I'm going to take a linear regression of this plot to estimate the ratio of interracial violence when the black population is equal to the white population. Here is the script to generate the plot. Here are the results:
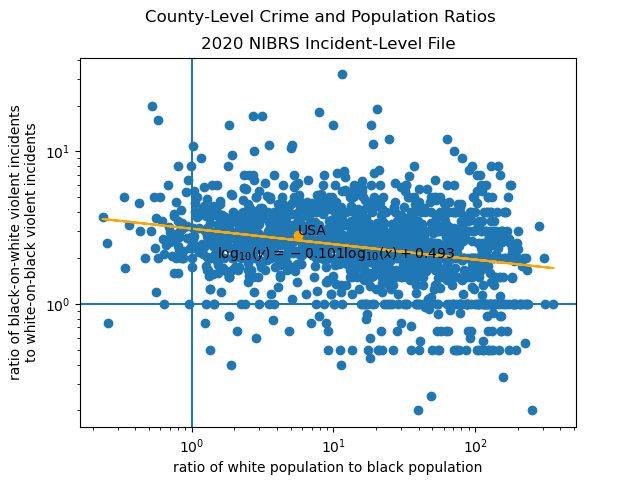
(In this paragraph, "white" means white (hispanic+non-hispanic)). According to this regression, the expected ratio of black-on-white to white-on-black crimes is 10^0.493 = 3.11 when the black population is equal to the white population. But just taking the total of the interracial crimes in the USA gives a ratio of 2.81. This underestimates the expected ratio of black-on-white to white-on-black crimes at equal population by a factor of 3.11/2.81 = 1.11.
(In this paragraph, "white" just means non-hispanic white). I will presume that the total of the interracial crimes in the USA from the NCVS underestimates the expected ratio of black-on-white to white-on-black crimes at equal population by the same factor of 1.11. The ratio of black-on-white crimes to white-on-black crimes from the 2021 NCVS is 6.87. The expected ratio of black-on-white to white-on-black crimes is then 1.11*6.87 = 7.63, if the white population were equal to the black population. Therefore, if the black population were equal to the white population in the United States, then it is expected that blacks would be 7.63 times as likely to attack whites as the reverse.
Notes
- ^ The NCVS - National Crime Victimization Survey - collects information on non-fatal personal crimes from a sample of about 240,000 Americans. The NCVS is informative about interracial crime (excluding homicide) at the national level. The 2021 NCVS report is available here. The datasets are available for full download here.
- ^ The NIBRS - National Incident-based Reporting System - captures details on single crime incidents from local law enforcement. The NIBRS is informative about interracial crime at the county level, with the limitation that hispanic white offenders are not distinguished from non-hispanic white offenders. The datasets are available for full download here
- ^ The NACJD - National Archive of Criminal Justice Data - is a collection of various datasets available for full download, including a few very useful ones like the National Crime Victimization Survey (NCVS), the National Incident-Based Reporting System (NIBRS), and the Uniform Crime Reports (UCR), which are cited extensively in Edwin Rubinstein's The Color of Crime [5] used by Jared Taylor. I'm adding a link to the NACJD to my sidebar.
- ^ The ICPSR - Inter-university Consortium for Political and Social Research - is a superset of the NACJD including various other datasets available for full download, related to opinion-polling, education surveys, and whatever else they've thrown in. I'm adding a link to the ICPSR to my sidebar.
- ^ The Color of Crime (2016 edition available here) is a report on racial crime statistics from several national and sub-national sources. It is written by Edwin S Rubinstein and published by the New Century Foundation, and used by Jared Taylor in his presentations.