
Click on a Country; I'll Tell You Where That Country Should Source Its Immigrants
Mousewheel or pinch to zoom.
The selected country should reject immigrants from the orange countries.
The selected country should accept immigrants from the white and blue countries.
The blue countries should reject immigrants from the selected country.
Premise
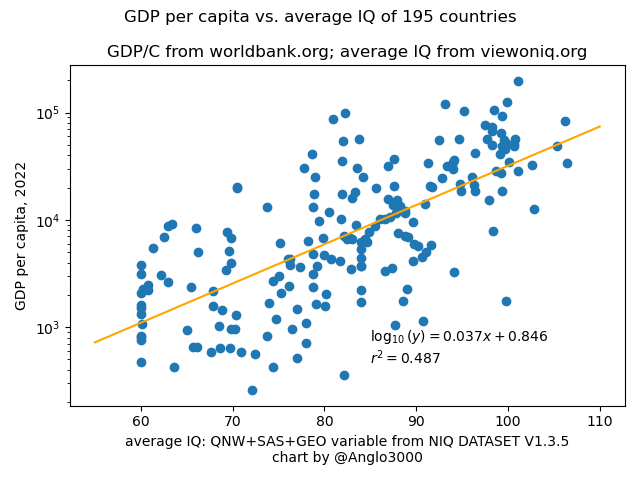
There is a strong positive association between a country's economic productivity, measured in GDP per capita, and the average IQ of that country's population. This is an aggregate effect of the fact that high-IQ individuals are more productive on average, as measured by their average income, than low-IQ individuals. The relationship between IQ and the wealth of nations is probably causal, with the former mostly causing the latter[1]. The strength of a causal relationship is not always strictly less than the strength of the observed linear correlation. The observed correlation can be less than the strength of the causal relationship due to a mitigating effect or a feedback loop. For example, high-IQ countries will give some of their wealth to low-IQ countries in the form of foreign aid, mitigating the observed correlation between national productivity and average IQ. To measure the strength of the causal relationship, a linear regression is not the final word, but it is a good first guess.
Question Presented
An immigrant with an IQ score \(\text{IQ}\) enters the country. He will increase GDP a bit by adding one unit to the population. He may lower GDP a bit by by lowering the average IQ of the country. How low does \(\text{IQ}\) have to be for the expected value of the change in GDP \(\Delta\text{GDP}\) to be negative?
Below, by assuming a linear relationship between the logarithm[2] of a country's GDP per capita and a country's mean IQ, \(\overline{\text{IQ}}\), I derive that if \(\text{IQ}\) is less than 11.7 points below \(\overline{\text{IQ}}\), then the expected value of \(\Delta\text{GDP}\) is negative. Therefore, countries whose average IQ is at least 11.7 points lower than the selected country are colored orange in the infographic above.
Does it make sense to interpret that a marginal immigrant can reduce a country's GDP just by reducing the country's average IQ? (Won't the immigrant just do a working-class job and mind his own business while everyone else stays as productive as they were the day before?)
Yes it makes sense to interpret that an individual's presence can reduce a country's GDP. The immigrant will have an effect on the productivity of everyone else. A resident can only exist in a country at the expense of every other resident. He takes up space on the highway, his children take up seats in the public schools, and he takes up resources from socialized healthcare. Even if the country has no socialized healthcare, a resident drives up the price of housing, the price of food, and the price of cars. His presence alone reduces the productivity of those around him. He also increases the productivity of those around him, by generating wealth in the economy through his occupation. But if his productivity does not offset the cost which he imposes on his neighbors' productivity by simply taking up space, he will be a marginal net negative on the country's total production. The response of GDP to the immigrant's presence can be modeled by the change in predicted GDP caused by the change in the country's mean IQ.
Deriving the 11.7 IQ point threshold
Begin with a linear regression predicting the logarithm of a country's GDP per capita based on its mean IQ: $$\log_{10} \frac{\text{GDP}}{P} = m \overline{\text{IQ}} + b + R$$
Here, \(\text{GDP}\), \(P\) (population), \(\overline{\text{IQ}}\), and \(R\) (the residual) are values of a particular country. \(m\) and \(b\) are parameters to the linear regression to the data for all countries, computed empirically below. The residual \(R\) represents circumstances particular to a country that make it deviate from the trend; such circumstances will be the same before and after the immigrant enters. The \(m\) parameter measures the response of log GDP per capita to a change in the country's mean IQ.
Solve for \(\text{GDP}\): $$ \text{GDP} = P10^{m \overline{\text{IQ}} + b + R} $$ Add a marginal immigrant \((\Delta P = 1)\) who has an IQ score \(\text{IQ}\). Calculate \(\Delta\text{GDP}\) using the chain rule: $$\begin{aligned} \Delta\text{GDP} &\approx \Delta P \frac{d\text{GDP}}{dP} \\ &= \frac{d\text{GDP}}{dP} \\ &= \frac{\partial\text{GDP}}{\partial P} + \frac{\partial\text{GDP}}{\partial \overline{\text{IQ}}} \frac{d\overline{\text{IQ}}}{dP} \\ &= \left(1 + m\ln{10}\left(P\frac{d\overline{\text{IQ}}}{dP}\right)\right)10^{m \overline{\text{IQ}} + b + R} \\ &= \left(1 + m\ln{10}\left(P\frac{d\overline{\text{IQ}}}{dP}\right)\right) \frac{\text{GDP}}{P} \end{aligned}$$ Estimate \(\frac{d\overline{\text{IQ}}}{dP}\) as \(\frac{\Delta \overline{\text{IQ}}}{\Delta P}\) when a marginal immigrant \((\Delta P=1)\) with an IQ score \(\text{IQ}\) is added: $$\begin{aligned} \frac{d\overline{\text{IQ}}}{dP} &\approx \frac{\Delta \overline{\text{IQ}}}{\Delta P} \\ &= \Delta\overline{\text{IQ}} \\ &= \frac{P\overline{\text{IQ}} + \text{IQ}}{P+1} - \overline{\text{IQ}} \\ &= \frac{\text{IQ} - \overline{\text{IQ}}}{P+1} \end{aligned}$$ Note that for every country, \(P\) is large enough that \(\frac{P}{P+1} \approx 1\), so \(P\frac{d\overline{\text{IQ}}}{dP}\) can be replaced with \(\text{IQ} - \overline{\text{IQ}}\). Finally: $$ \boxed{ \Delta\text{GDP} \approx \left(1 + m\ln{10}(\text{IQ} - \overline{\text{IQ}})\right) \frac{\text{GDP}}{P} }$$And thus the result, according to the simple model:
\(\Delta\text{GDP} > 0\) (economic growth) when \(\text{IQ} > \overline{\text{IQ}} - \frac1{m\ln10}\) \(\Delta\text{GDP} < 0\) (economic contraction) when \(\text{IQ} < \overline{\text{IQ}} - \frac1{m\ln10}\)
Find \(m\) using GDP per capita by country data from The World Bank and average IQ by country data from David Becker's View on IQ:
Implications for Immigration Policy
In the case of non-selective immigration (refugee immigration, diversity visa immigration, permissive illegal immigration), immigrants from a country are just randomly selected residents from that country. The average IQ of the marginal non-selective immigrant is just the average IQ of his country of origin. Therefore, non-selective immigrants from orange countries in this article's infographic should simply be halted and rejected.
What about selective immigration of skilled, professional immigrants? Due to chain migration, the average effect of a marginal skilled migrant is in many cases closer to the effect of an average migrant from the same country of origin. Even so, it may be possible to design a system of skilled immigration with the goal in mind to maintain or increase domestic productivity. But such a system is much more easily prone to failure than a system of simply rejecting immigration from low average-IQ countries. The simplest system would be to accept an immigrant if he is a citizen of a non-orange country and reject him if he is not.
India is known to generate more economically productive migrants than would be predicted by looking at just the average IQ of India. I would attribute this to India having a multi-modal IQ distribution caused by the caste system. Skilled migrants from India are more likely to be high-caste, and the chain migrants of skilled Indian migrants are also likely to be high-caste, whereas in other countries the chain migrants of skilled migrants are more likely to be average for their country. Nevertheless, the simplest system would still be to accept an immigrant if he is a citizen of a non-orange country and reject him if he is not.
According to the model in this article, if an 85-IQ Nigerian (bright compared to Nigeria's average) moves to Canada, then the expected effect is to reduce the GDP per capita of both nations and reduce the GDP of both nations. At the same time, according to the model in this article, if an 85-IQ Canadian (underachiever compared to Canada's average) moves to Nigeria, then the expected effect is to increase the GDP of both nations and increase the GDP per capita of both nations. We should find a way to encourage more of the latter kind of migration.
Notes
-
^For commentary on the causal relationship between national IQ and GDP per capita, see Gregory Christainsen's 2016 paper.
For commentary on the causal relationship between national IQ and economic growth, see George Francis's post about his and Emil Kirkegaard's 2022 paper. -
^GDP per capita grows exponentially over time. At any given time, a nation's GDP per capita is just a sample of some exponential-curve time-series. It should surprise no clever reader, then, that the distribution of GDP per capita of nations is often found to be log-normally distributed:

- ^Using other national IQ variables from the same NIQ dataset (such as L&V12, Lynn & Vanhanen 2012, giving \(m=0.044\); or such as R, Becker & Rindermann 2016, giving \(m=0.041\)) yield higher values for \(m\) and thus tighter IQ thresholds for economic growth from the marginal immigrant. However, I'm assuming that Becker's QNW+SAS variable or QNW+SAS+GEO variable, which aggregates national IQ estimates from the largest number of studies, is the closest to reality.